curious if anyone else has any thoughts on maybe trying to collaborate on coming up with a general purpose video signal diagram semiotics that could be easily adapted to any kind of digital/analog video signal flow zones? kind of like how circuit diagrams work? i do this a lot but its kind of only useful to myself if i’m just using symbols only i understand hahah.
but like there are some like primitives in video signal processing that transcend any kind of analog/digital implementations maybe we make a list of those first? from a category theory/network theory approach it is sufficient to just divide things into objects and arrows (arrows being how a signal is transformed as it goes from one object to another)
objects
*mixer
*color space mapping
*filter
*delay-maybe buffer instead of delay?
*rescale/ xyz rotate displacement/ stretching and warping? not sure if these are all 1 thing or different things?
arrows
*attenuation/attenuversion
*offset
*nonlinear/transcendent functions (sin, cos, exp, log)
what other kinds of transformations are there? is this it? i think maybe in terms of translating this kind of thing into like a pd max/msp thing these arrows could actually just be little math blocks and then the arrows just mean the 1 function of a signal travelling somewhere in space/time
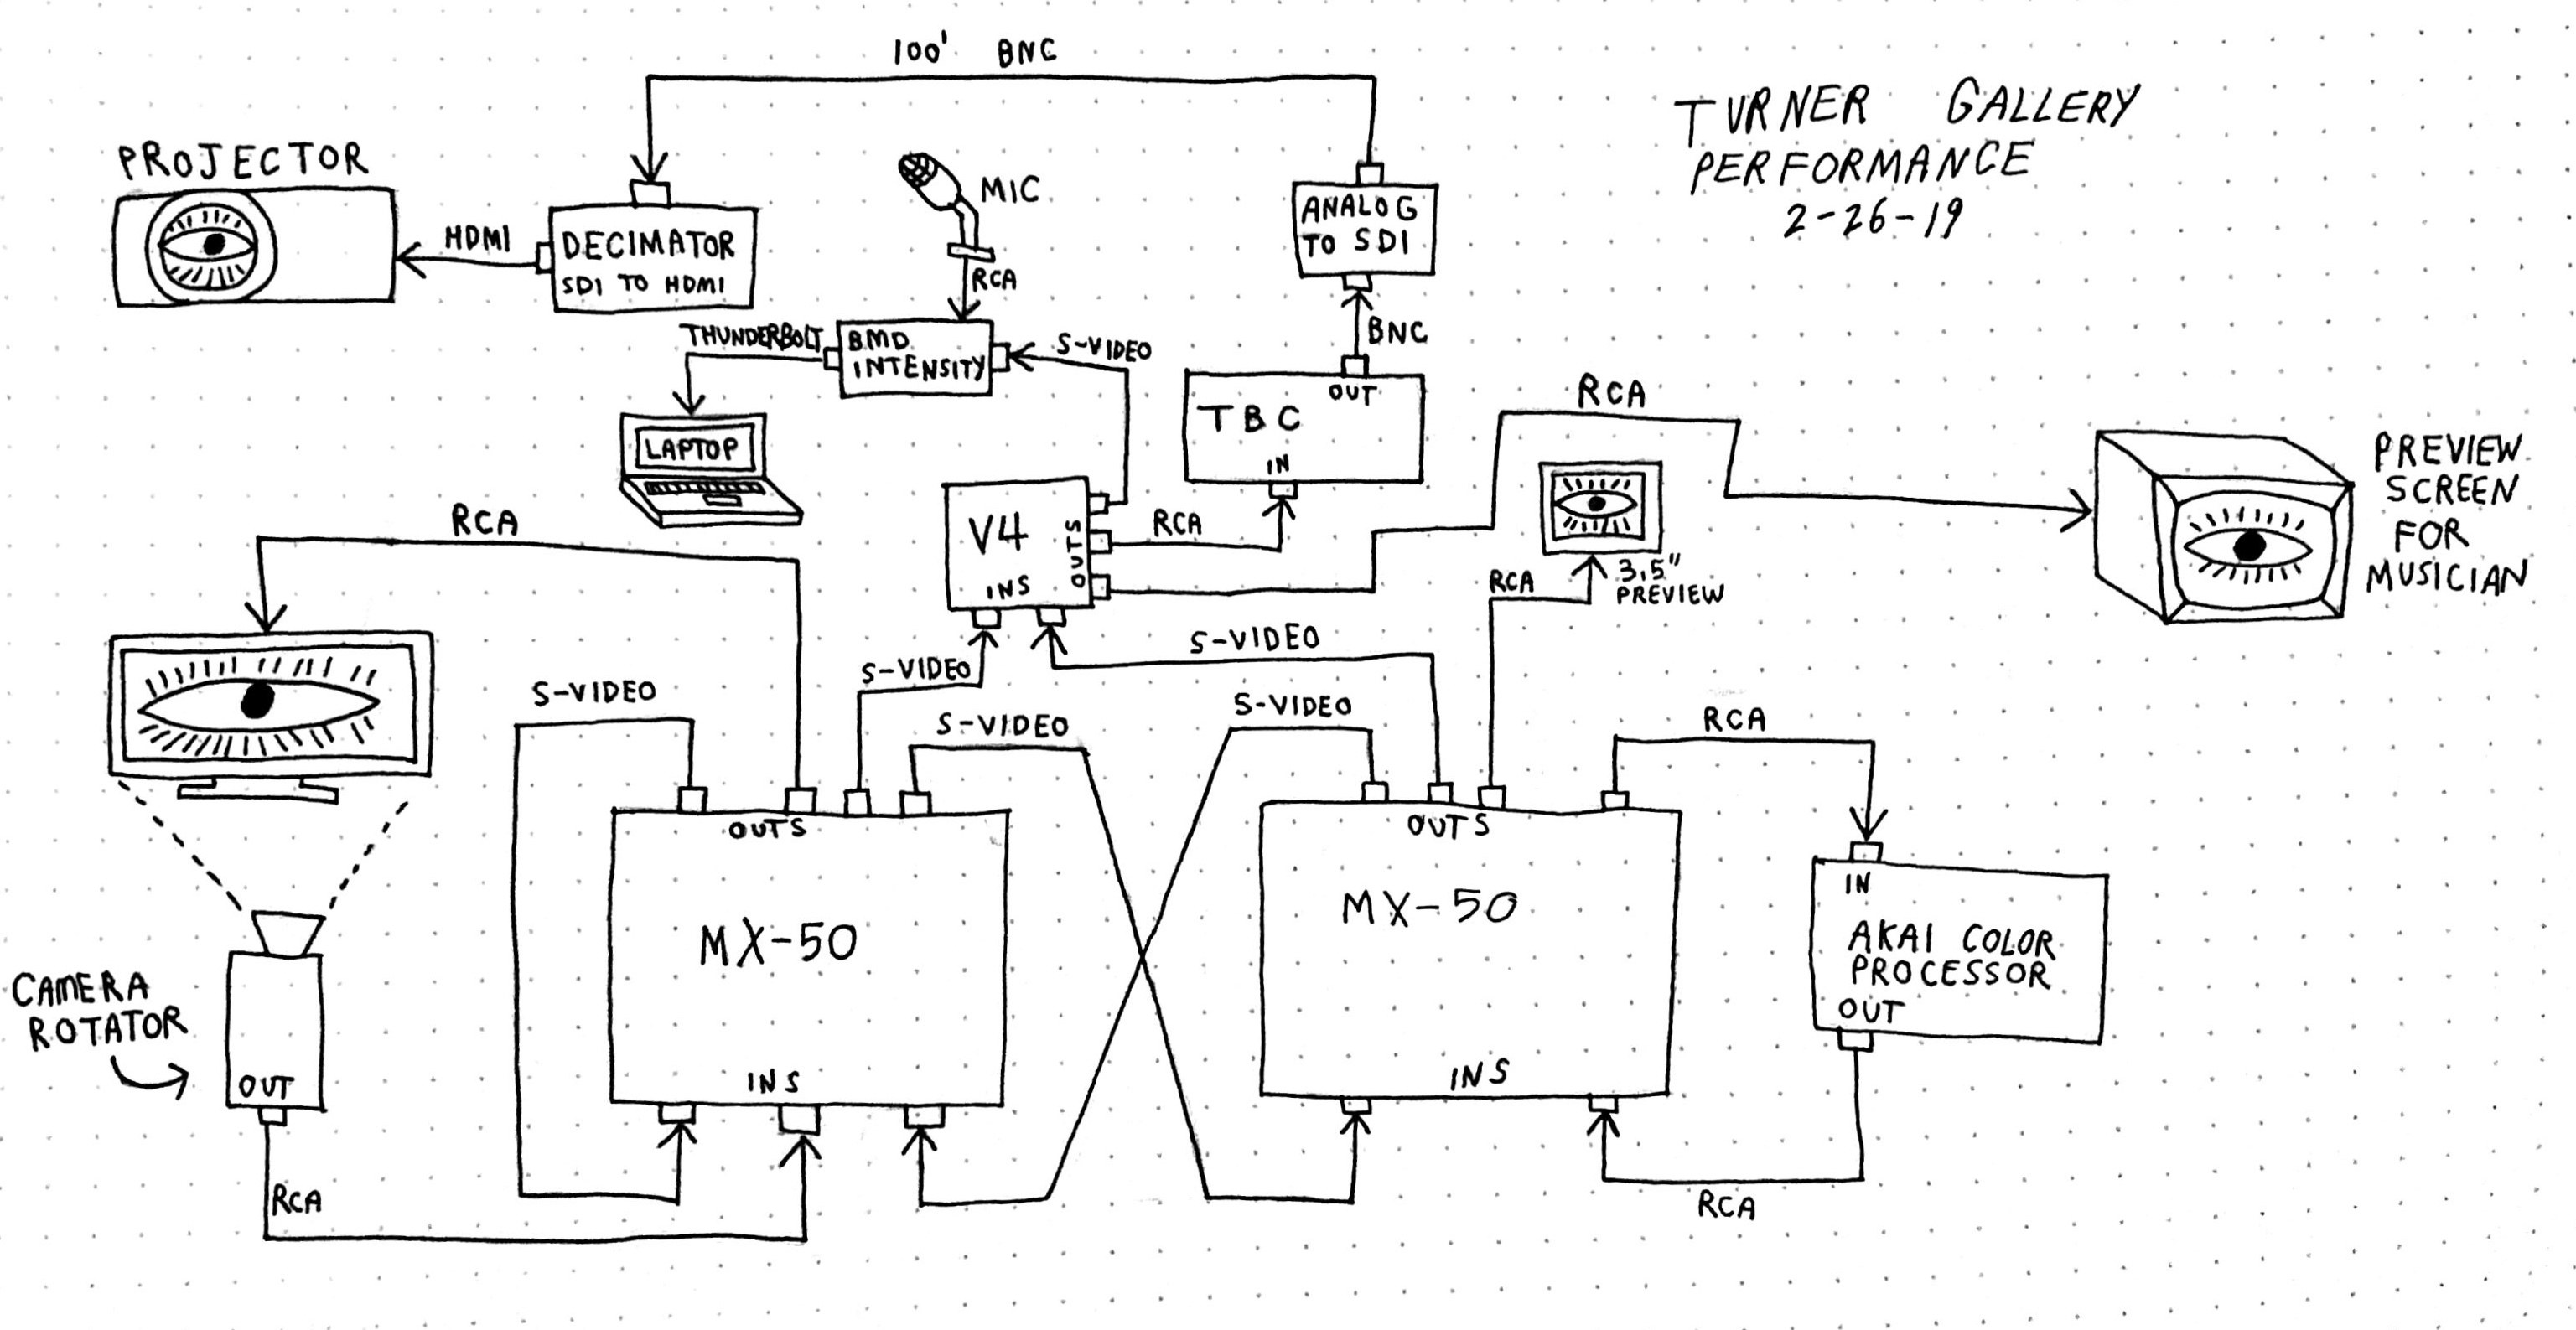
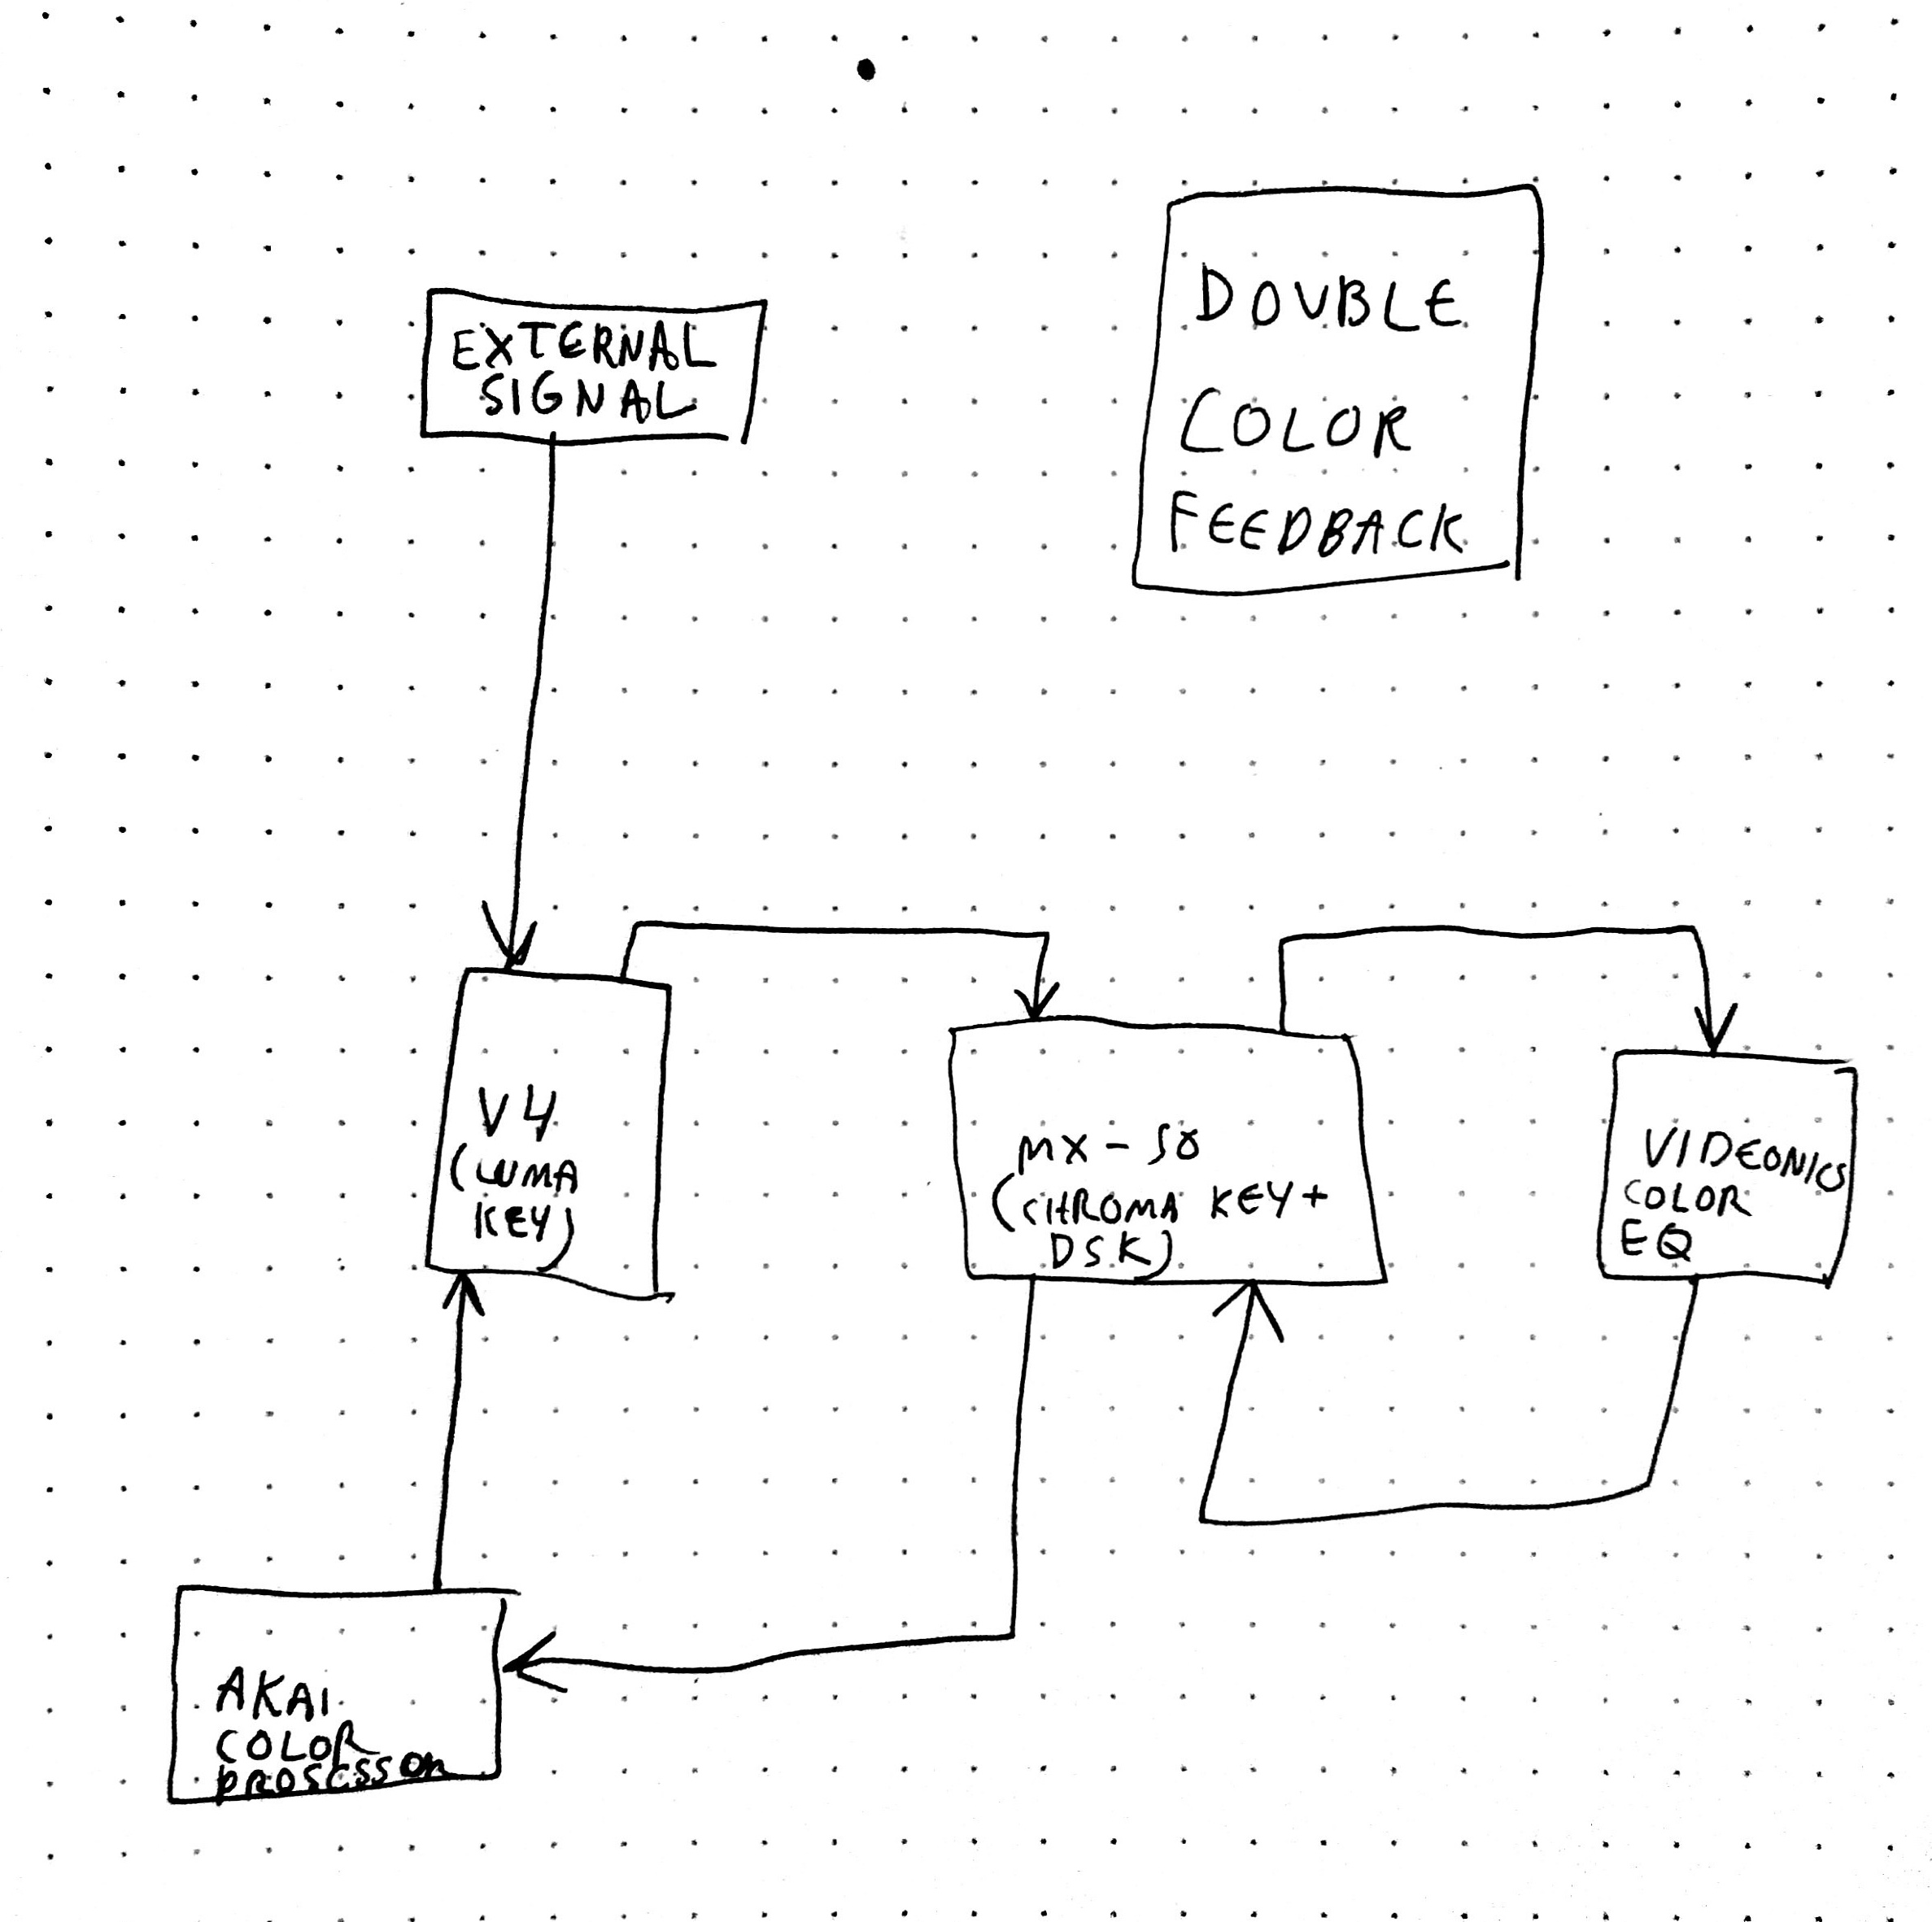
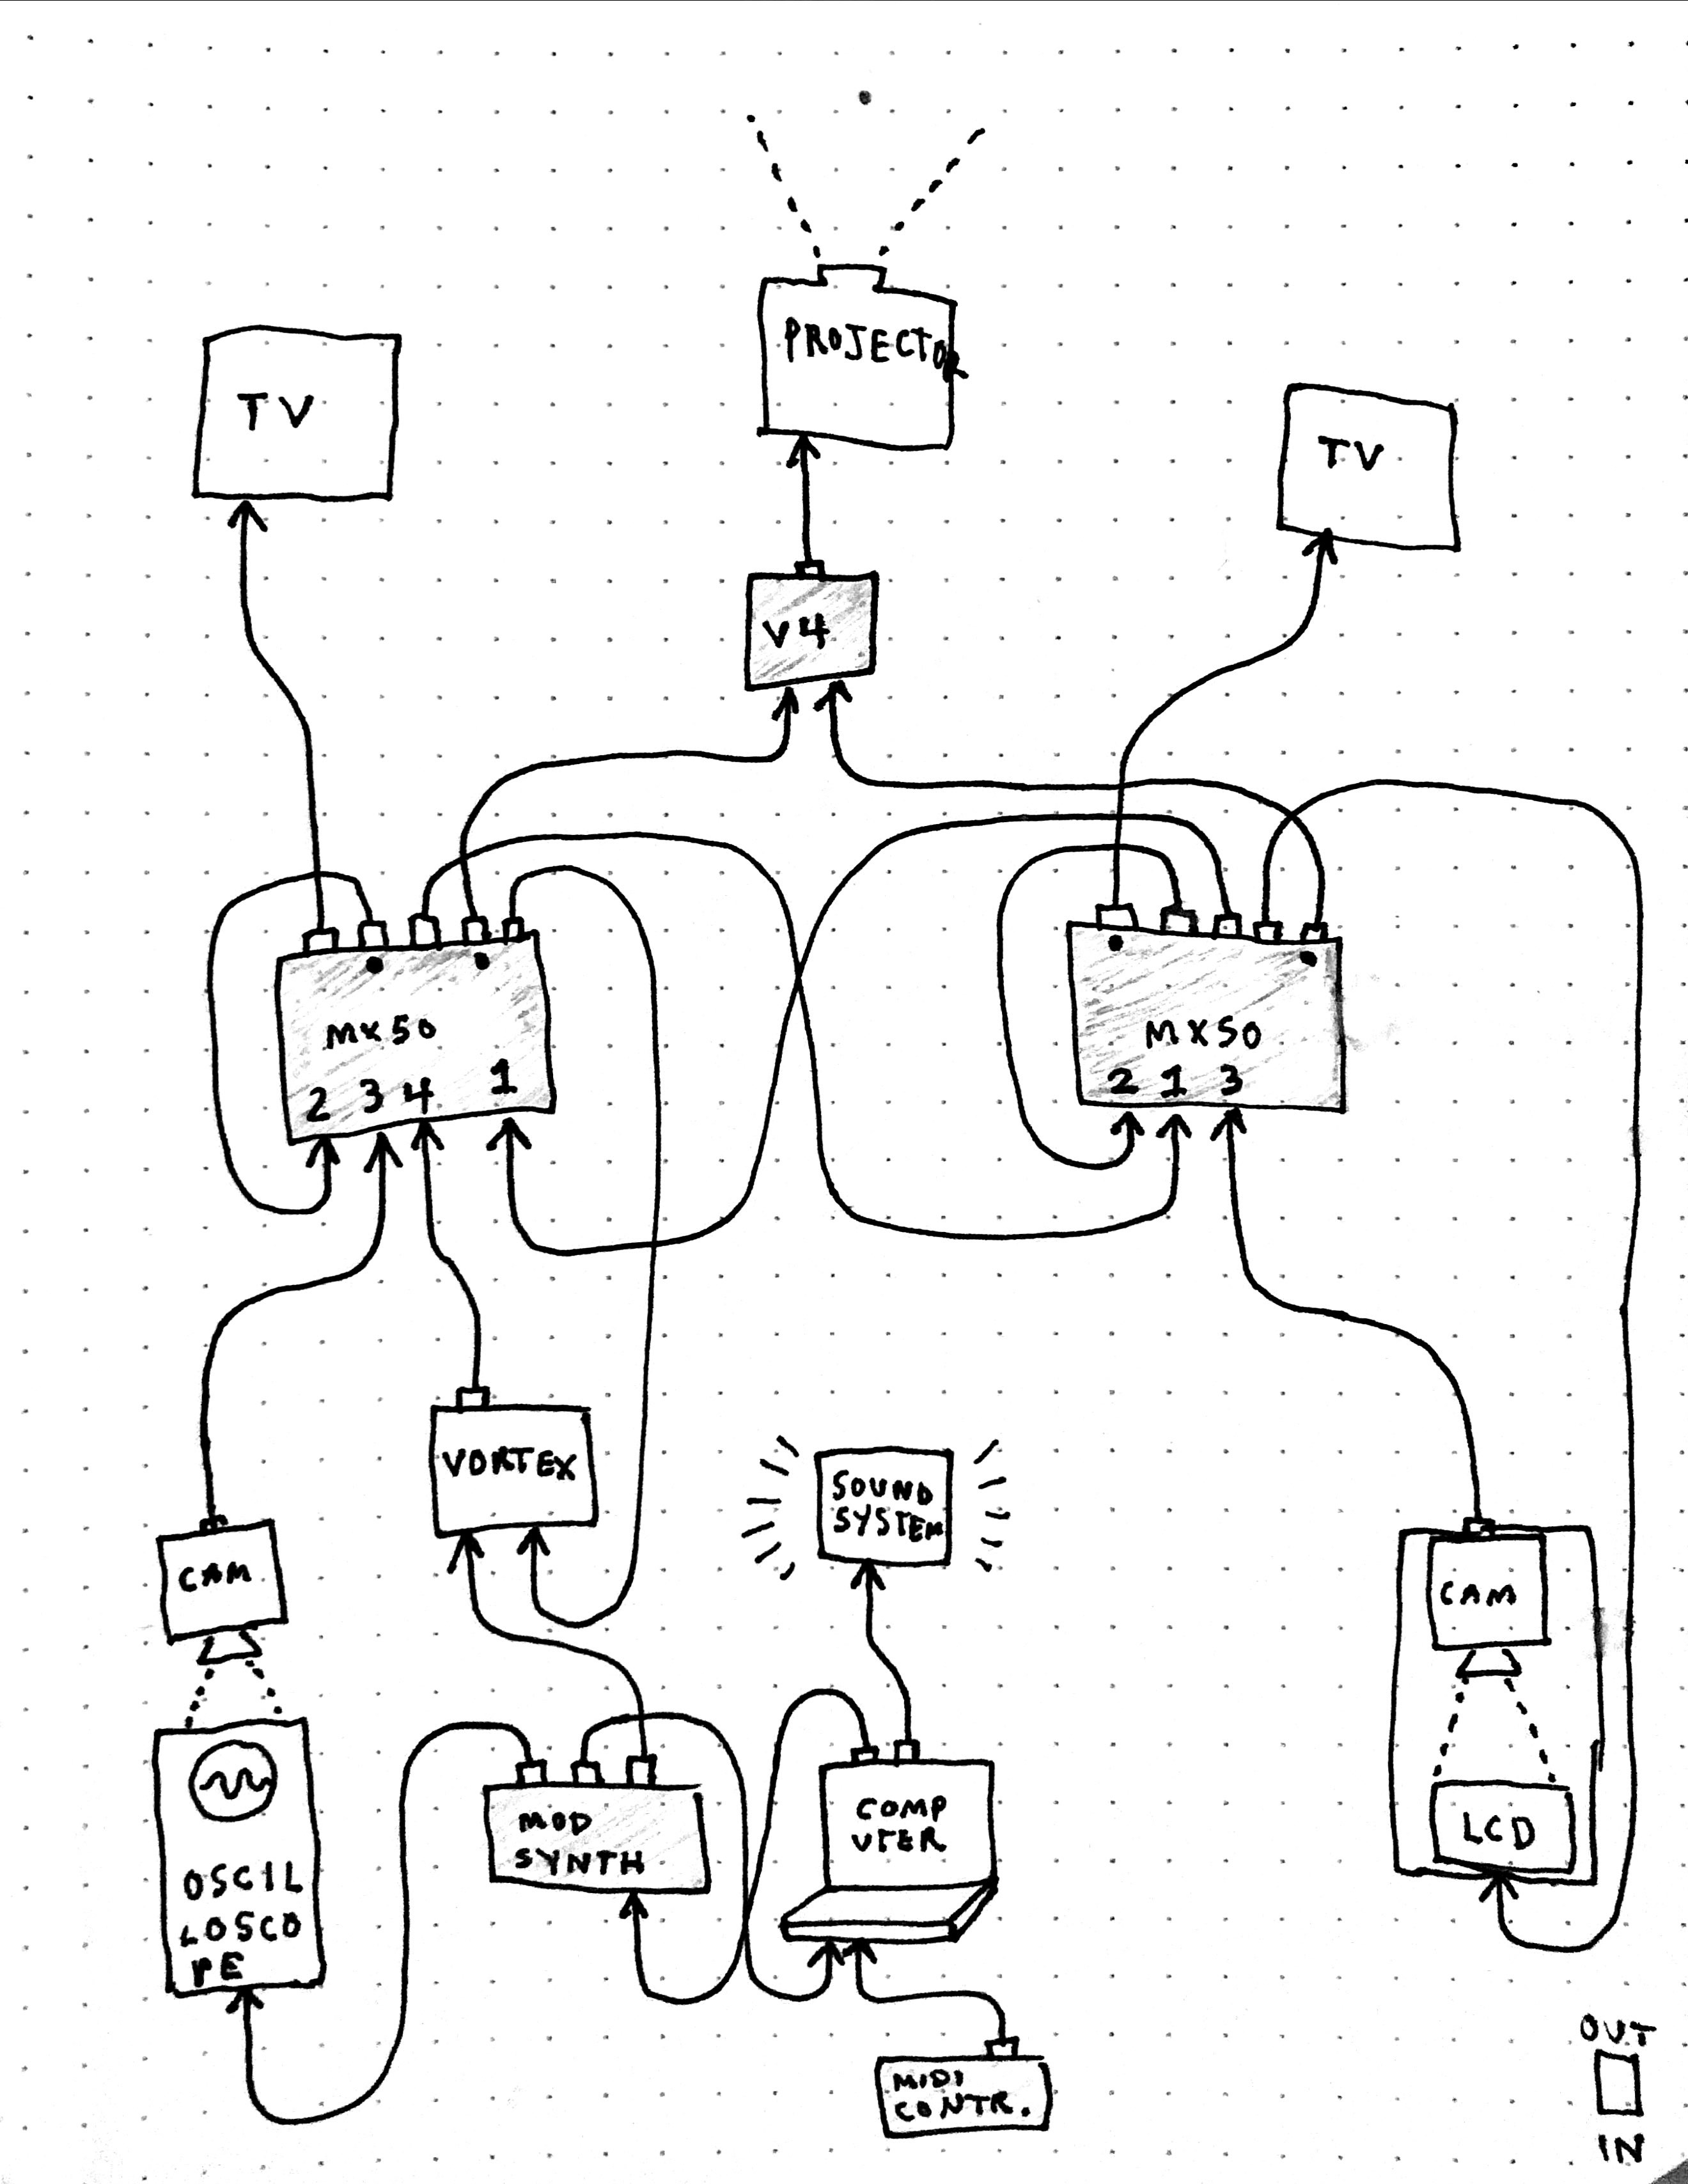
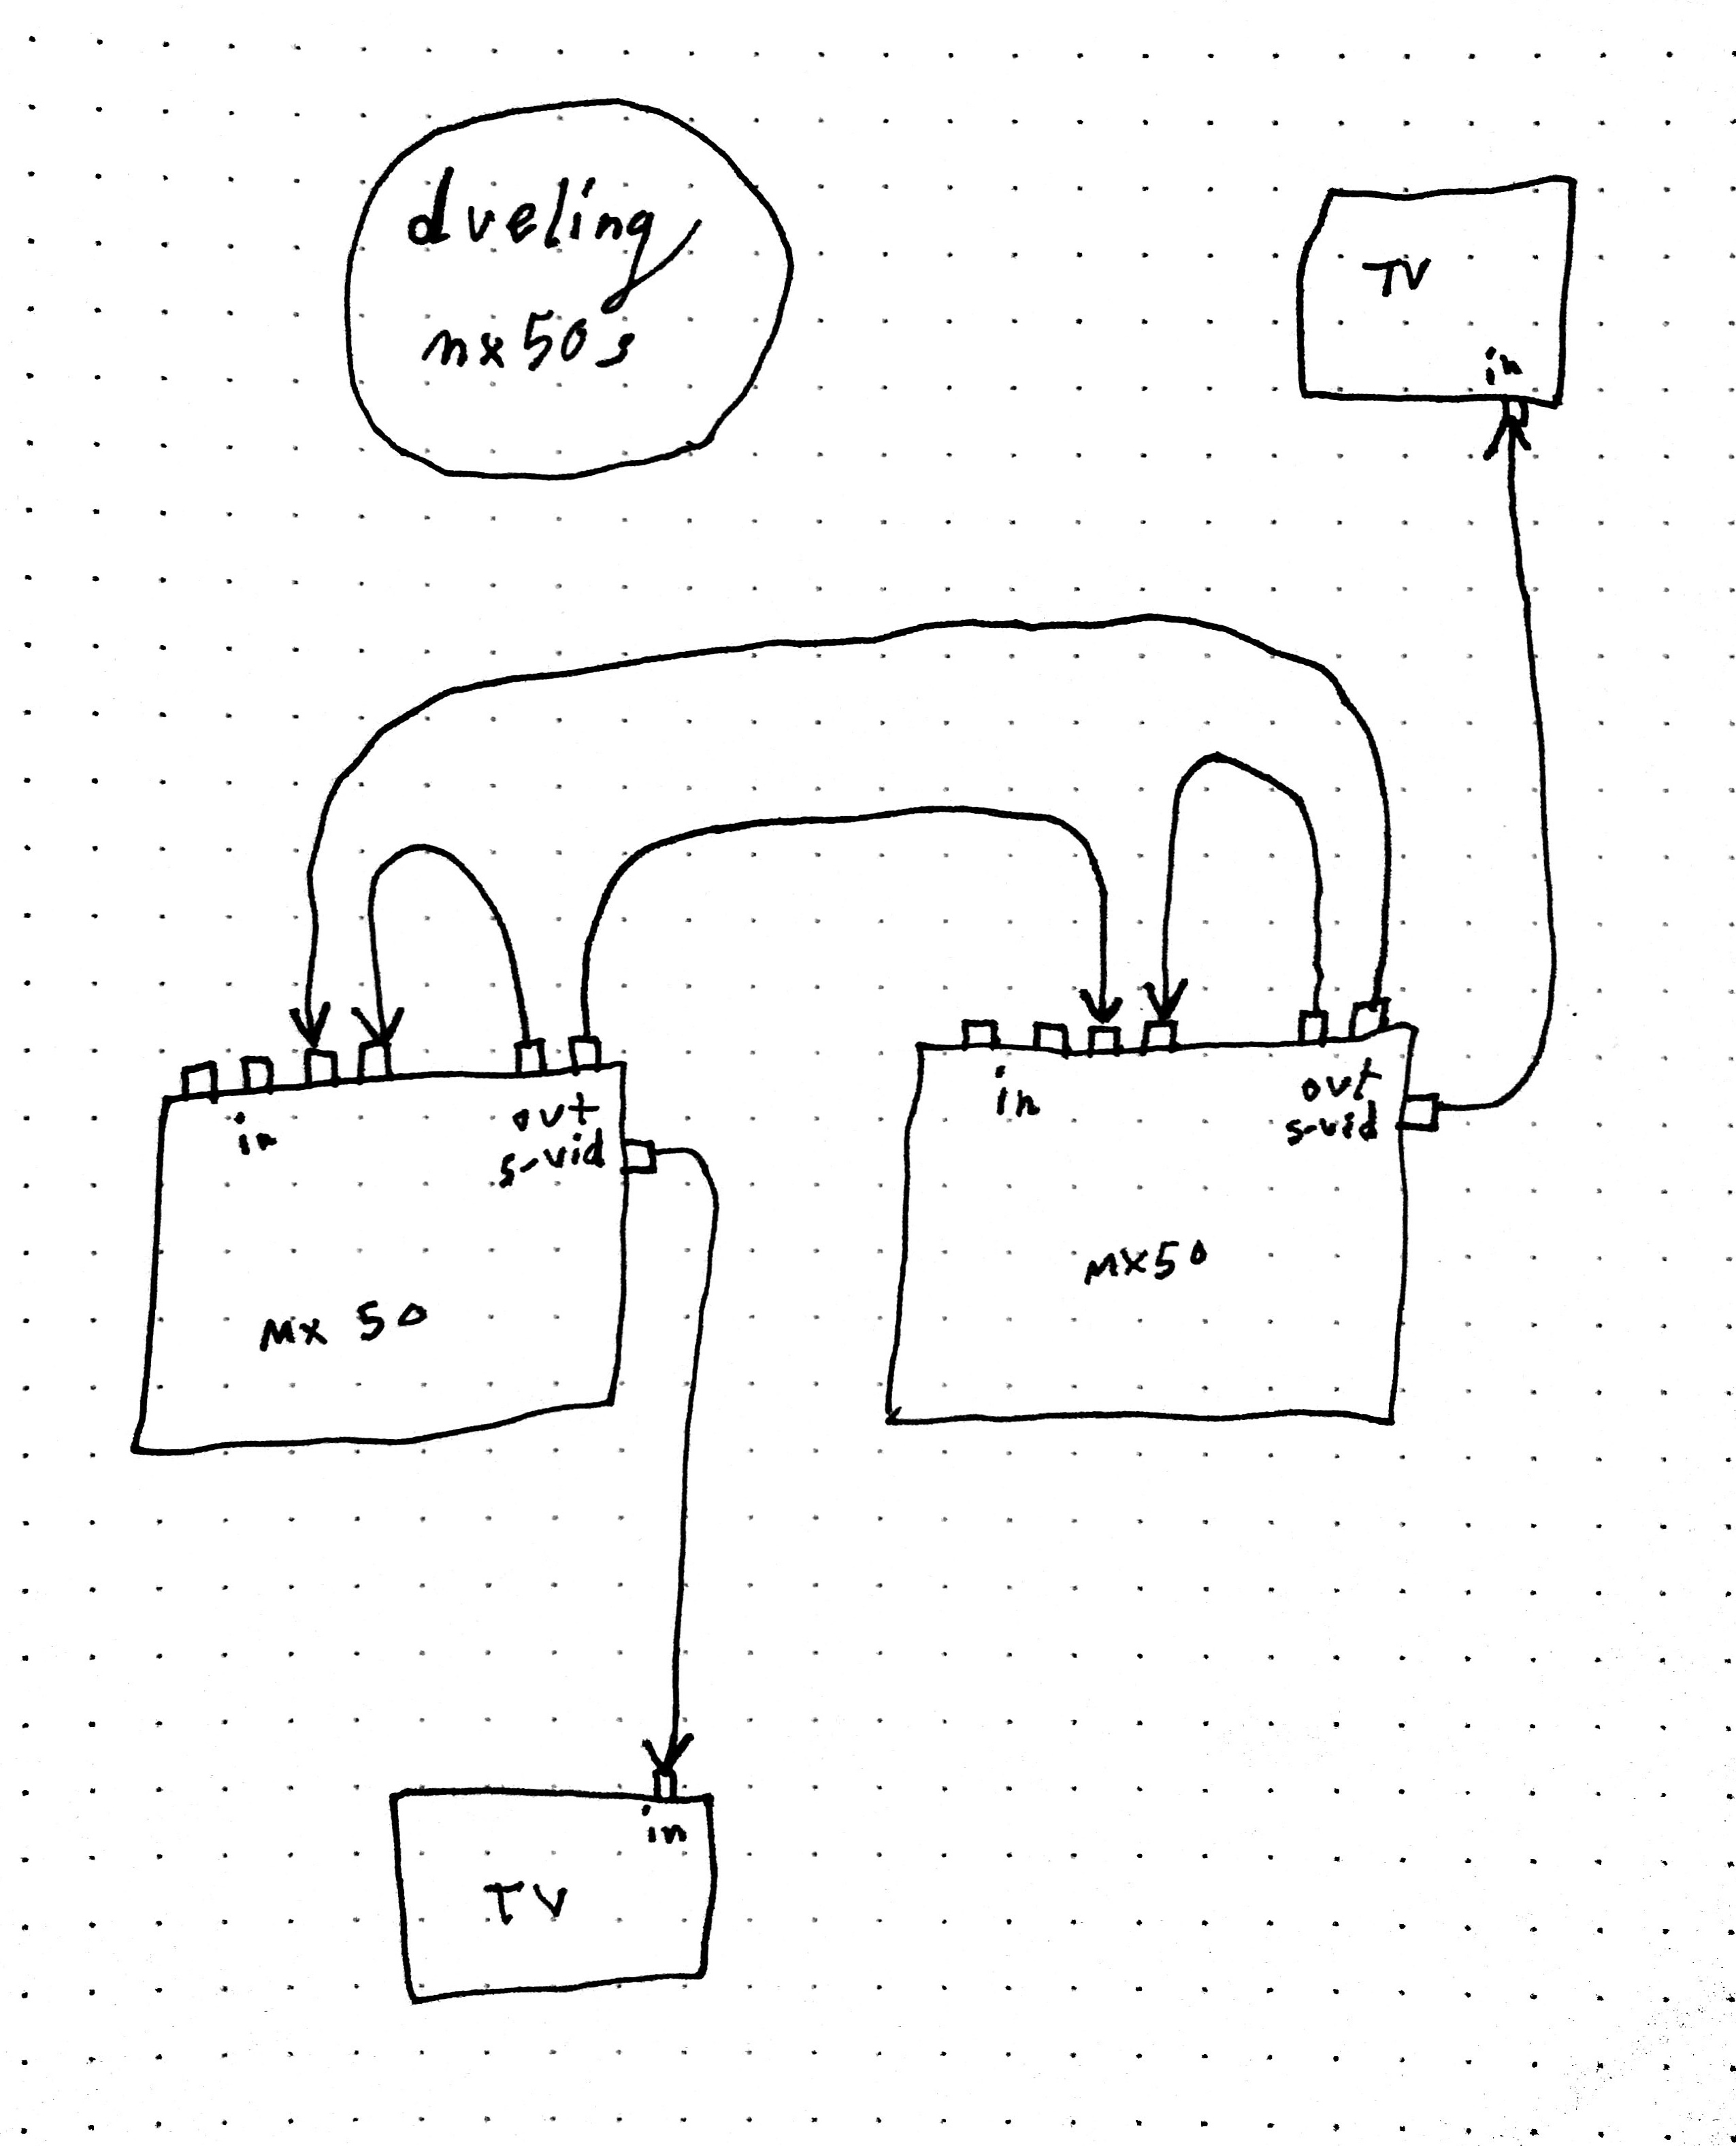
i thought i’d share some of my own diagrams. not sure if this is a direct answer to your question, because these are also intended only for myself, and don’t contain any information about the settings of my devices or transformation of the signal, they are just an aid to remember how to plug everything in - usually for performance but sometimes just for setups for recording in the studio.
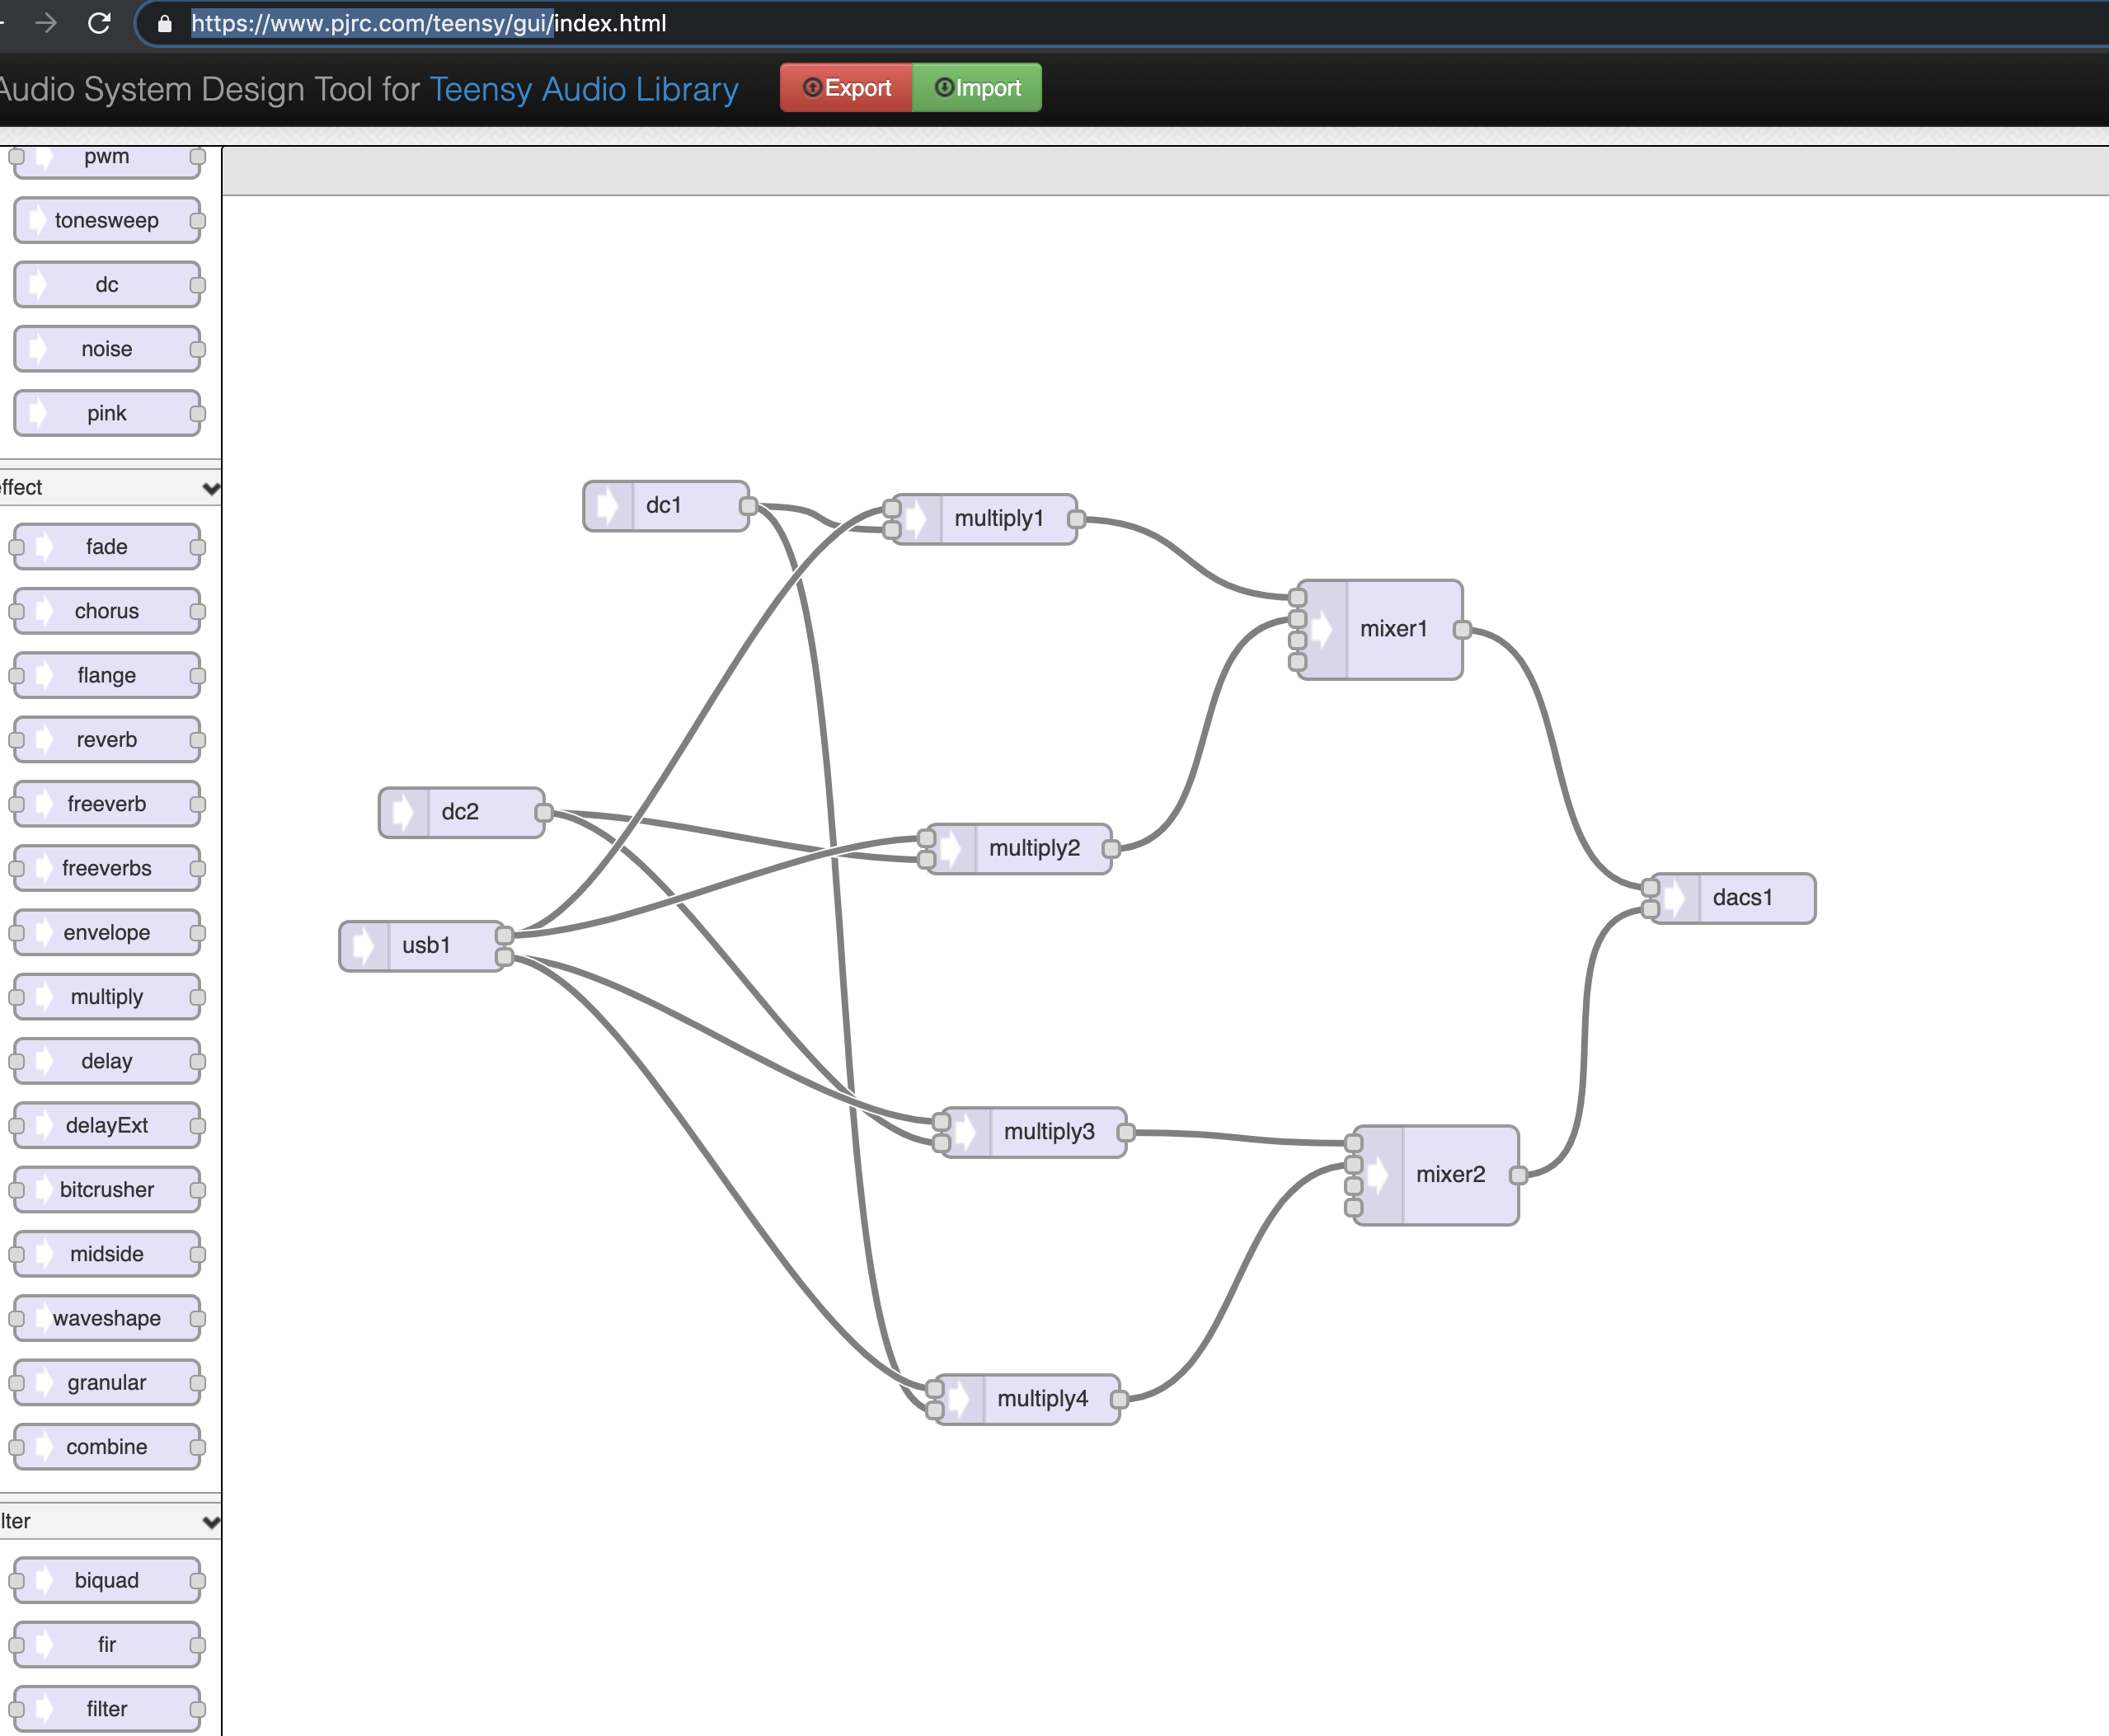
also a little bit tangental but i have been using the teensy audio library lately and it has this great gui for auto-generating code for patched objects:
(incidentally this my mockup of rotation in 2d plane - where dc1=sinA, dc2=cosA and one of the mixer inputs is set to -1 gain)
it is based on an open-source project called nodered.
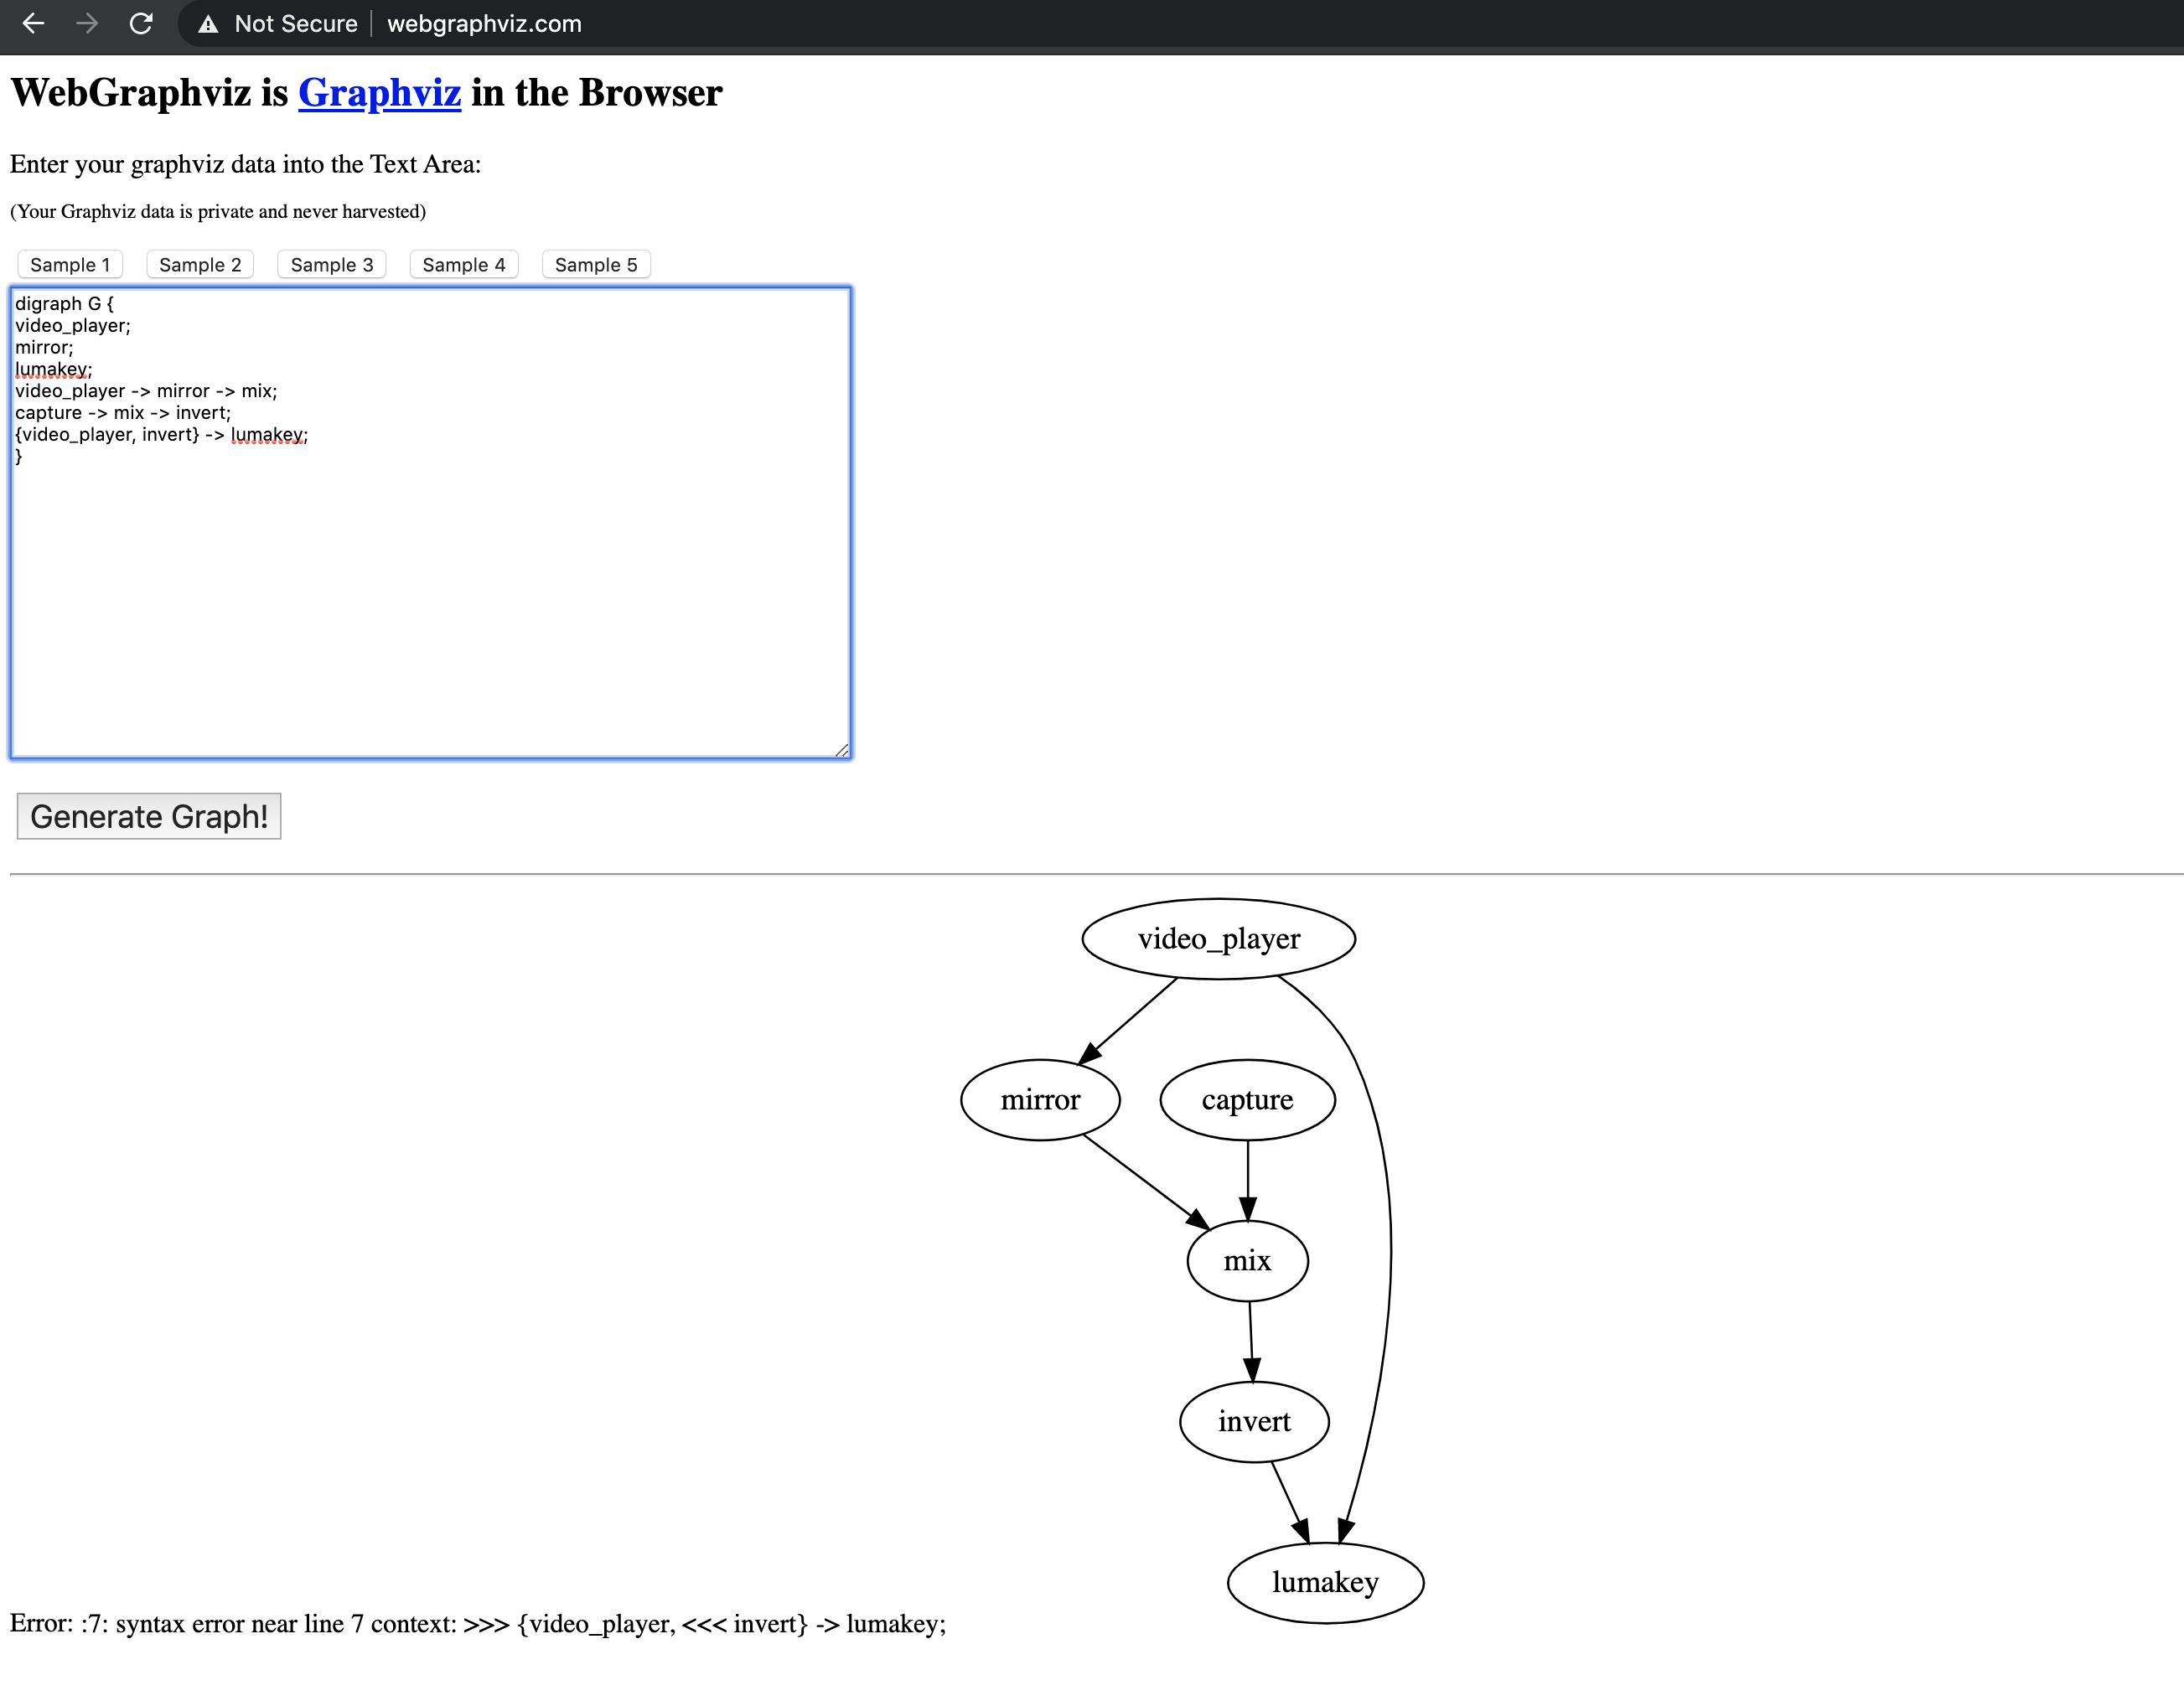
for a bit more general approach also check out dotlanuage / graphviz - a well supported syntax / open-source tools for describing graphs.
there was some wip (by Mike Panciera) to modify the recur backend to read these descriptions so users could create custom patches of the internal nodes like video_player , feedback , shader, capture etc
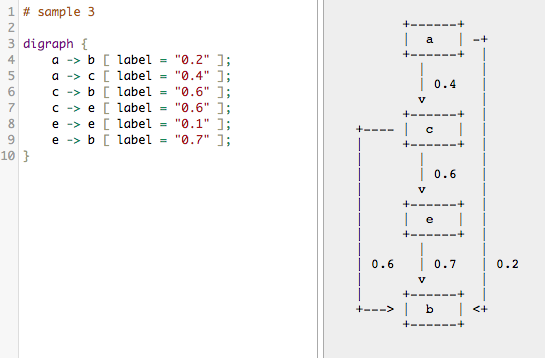
one thing i like about this one is that arrows can have labels - which might get at the “transformation” notation @andrei_jay mentioned earlier. for example in “sample 3” at the bottom.
i’ve always wanted to use it for making some technical diagrams - i actually need to make some for my current book project so maybe that time has finally come…
!!! that is really cool - it actually crossed my mind to see if something like this exists already when i was thinking about how to display node-graphs in recur (without breaking the ascii aesthetic )
yes. maybe i will try slip some ascii diagrams into the technical documentation at my work too, see if anyone notices…
Ooo I really like that ascii flow generator. One thing I would love to add to hydra is a way to switch between a code view and a signal-flow view, where you could edit either one.
Not yet, but various people have been making their own editors or adding hydra to other projects. Someone made this one just a few days ago: https://hydra-blockly.glitch.me/
(try dragging anything from the ‘I/0 texture’ category and then ‘.out()’ afterwards)
wow! just want to reiterate how amazing i think hydra is. i have mentioned to many folks that i never really give myself time to play around with like anyone elses code zones for video stuffs because of how wrapped up i get in developing and debugging my own stuffs when i’m sitting at a computer but like any time i have a tutorial session where someones like “i want to learn code and i want to make video” i always head over to hydra because its like it takes someone about 10 minutes to go from no experience writing code to like something crazy awesome happening
i also really enjoy hydra and the immediacy of it! you just open up the browser and there it is. side note, i just ended up playing with the “blocky hydra” for a bit - it’s weirdly satisfying.
i’ve been able to embed videos but they need to have an empty line above and below - going to add that to the sticky … though think its a bit of an annoying aspect of discourse itself. i haven’t been able to change it though.
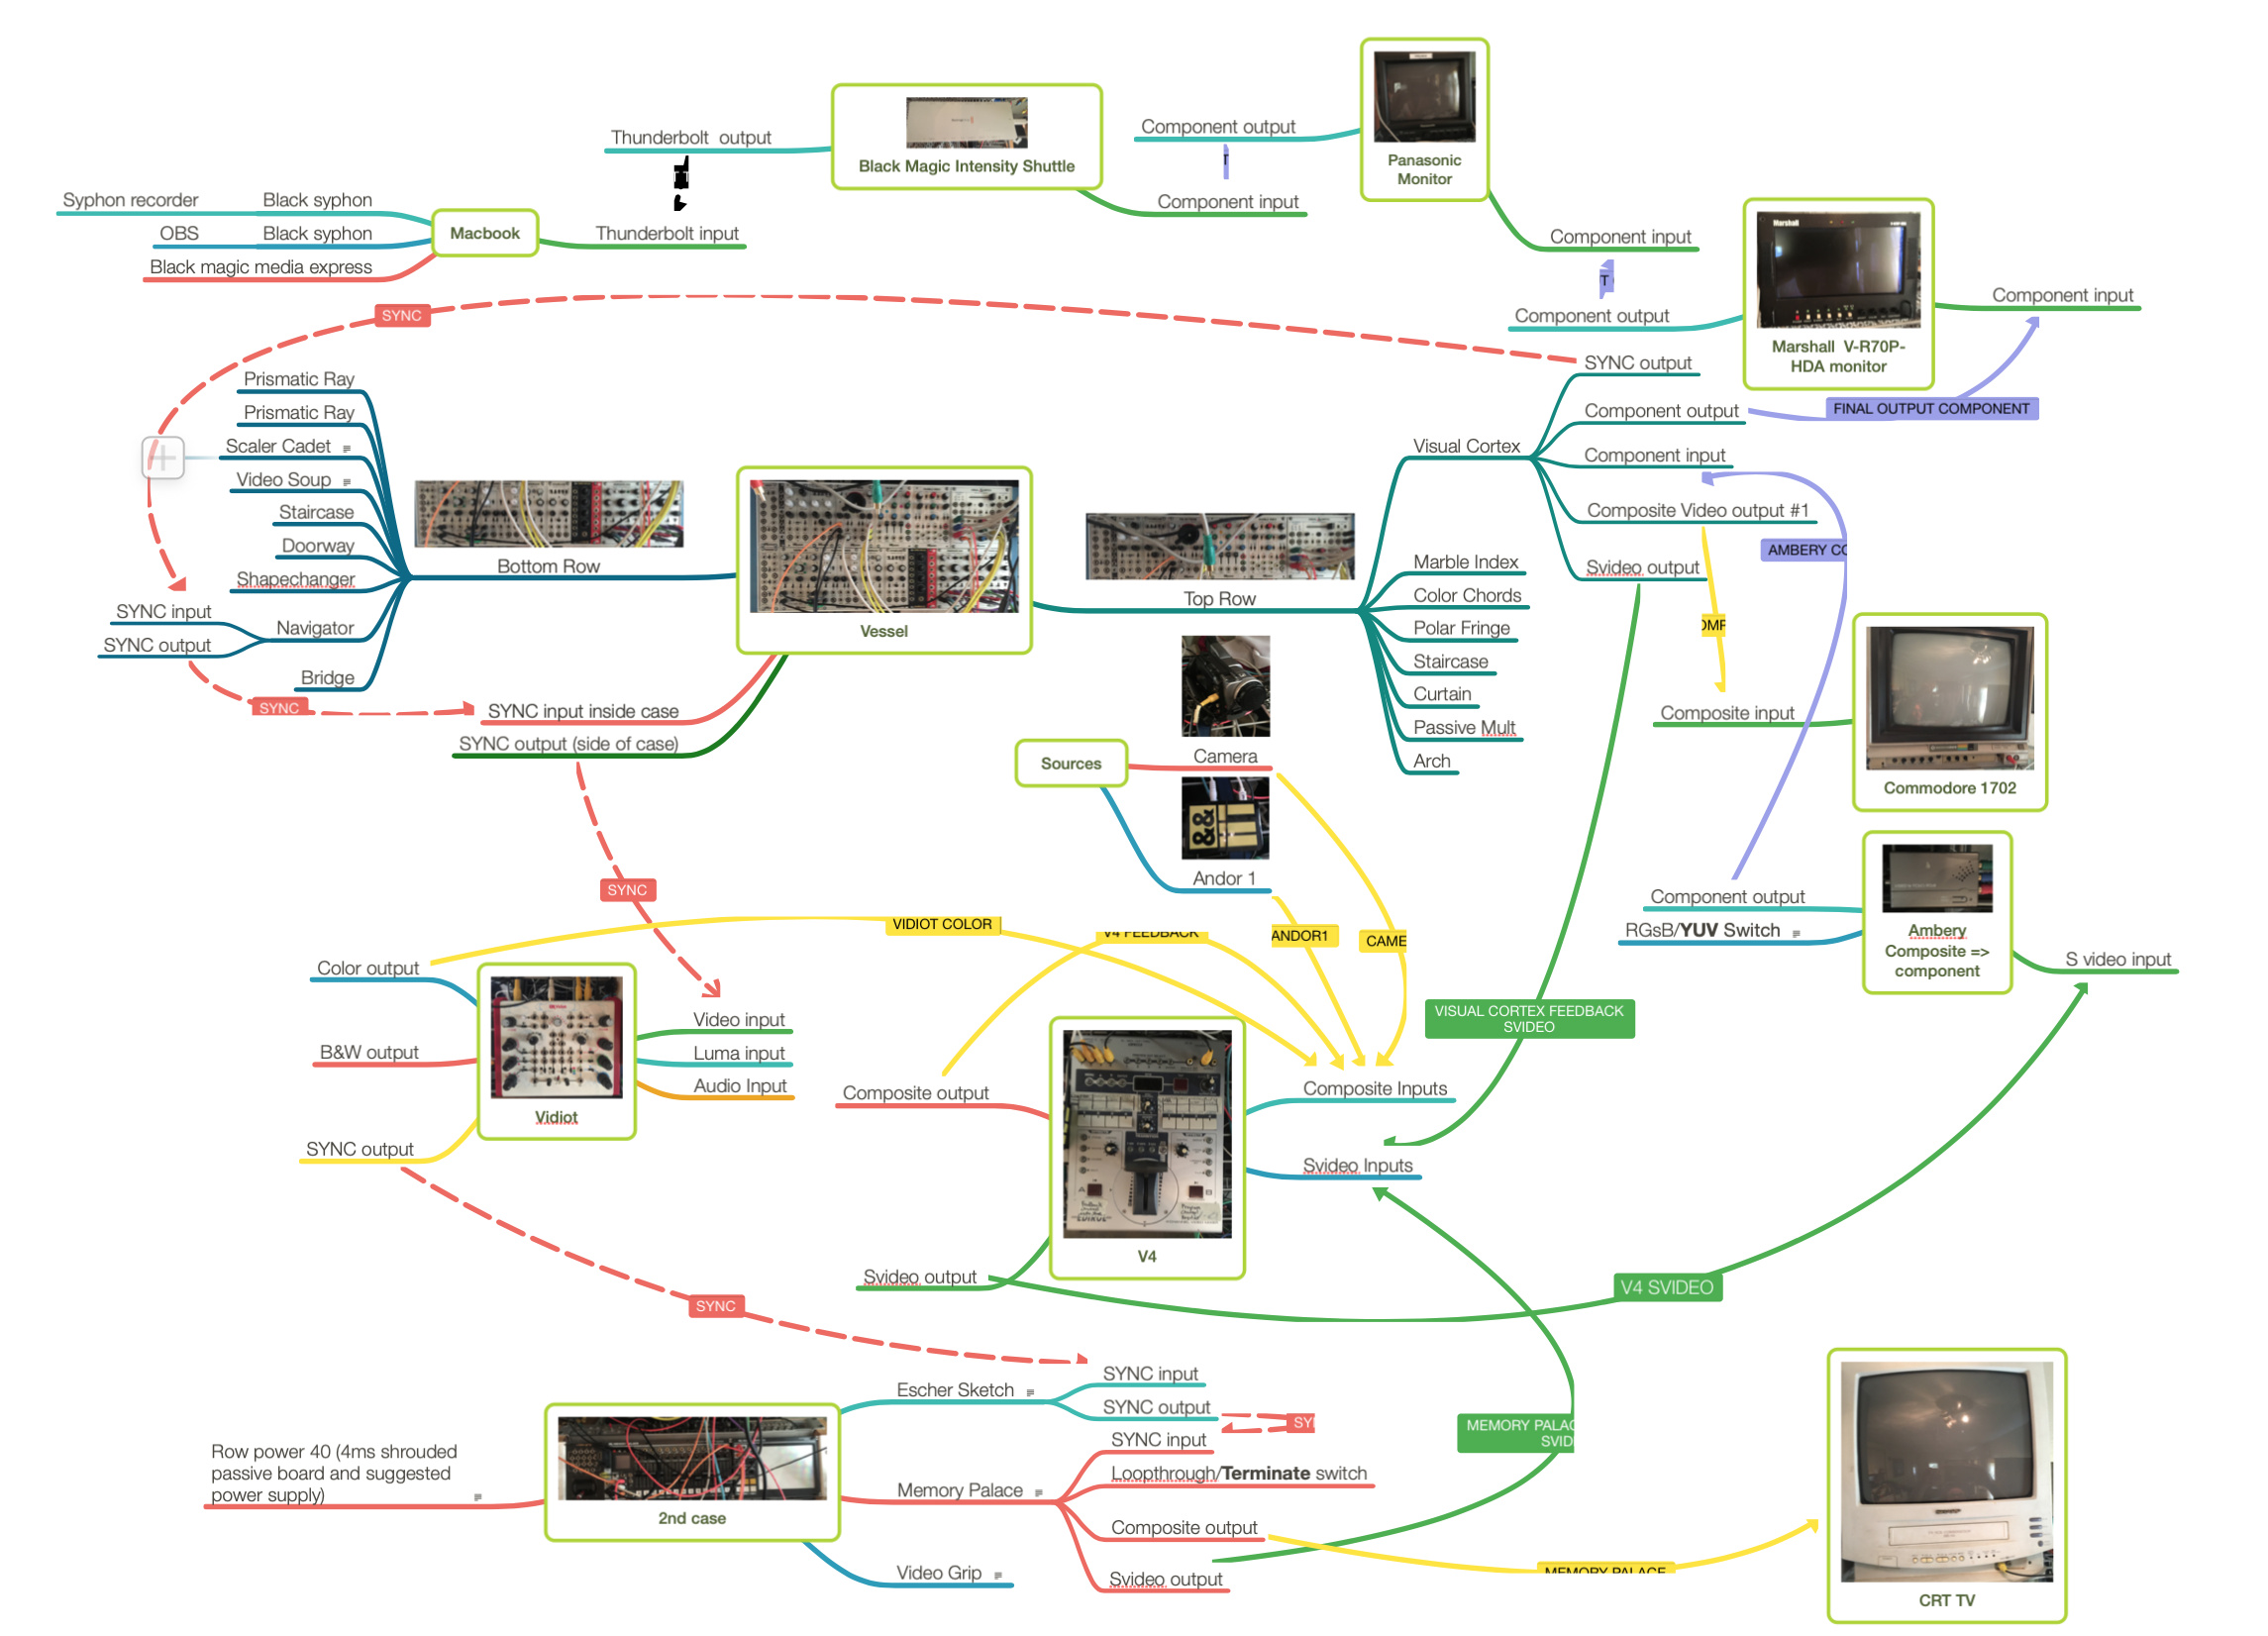
here is something I did a long time ago for my old setup using a program called mind node
yellow for composite
green for svideo
purple for component
red for sync
it wont install. i dont really get it - its in the official discourse project , which has been updated this week… can try installing it manually later …
There are a lot of standard symbols used in service manual block diagrams. For example a buffer (voltage buffer, not image buffer) will always be a triangle, oriented pointing from left to right, with the signal going in to the flat side of the triangle in the middle, and going out the point. Similar to an opamp. If you notated “x25” inside that triangle, one could assume that it has a gain of 25.
Multipliers are either circles or squares with an ‘X’ in the middle. The carrier going in on the left side, the modulator either the top or bottom, and the product out the left.
Adders I’ve seen notated a few ways, either like a multiplier but with a + instead of an x in the middle of the symbol, or I’ve sometimes seen the sigma symbol used. I assume math block notations influenced all these.
Things get a bit more difficult when trying to express a differentiator or integrator, I’ve either just written differentiator or integrator in a square, or drawn a highpass or lowpass slope.
Attenuators can be drawn as a buffer, but with a line strike through diagonally.
The more complex a single block becomes, the more I’ve just written inside the block. I might not want to draw all the component blocks of a rotator, so I’ll just draw a box and write ‘rotator’ in the middle.
So my perspective is very much schematic shorthand, and with shorthand there is a fair amount of user translation.